Boulder Real Estate Market Update – February 2026
Insights from Kiki Kidder & Brad Thomas | Realtors at Compass
Each month we review housing data for Boulder, Colorado and Boulder County to help buyers, sellers, and homeowners better understand local real estate trends. The February 2026 market update below summarizes recent activity including new listings, homes sold, average sale prices, and showing activity, based on data from REColorado and ShowingTime available as of March 5, 2026.
Key Takeaways — February 2026 Market Data
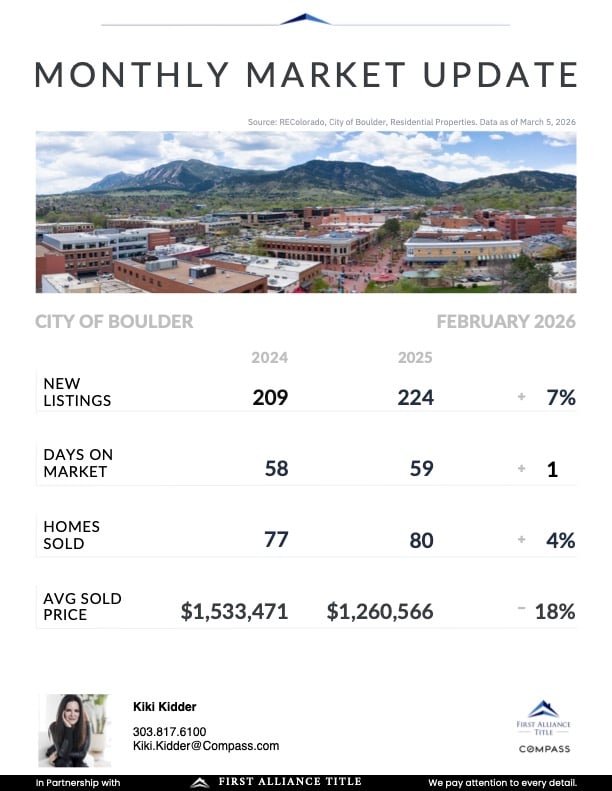
• New listings in the City of Boulder increased 7% year over year, rising from 209 to 224.
• Homes sold increased slightly, from 77 sales to 80.
• Average sold price in Boulder was $1,260,566, compared with $1,533,471 the previous year.
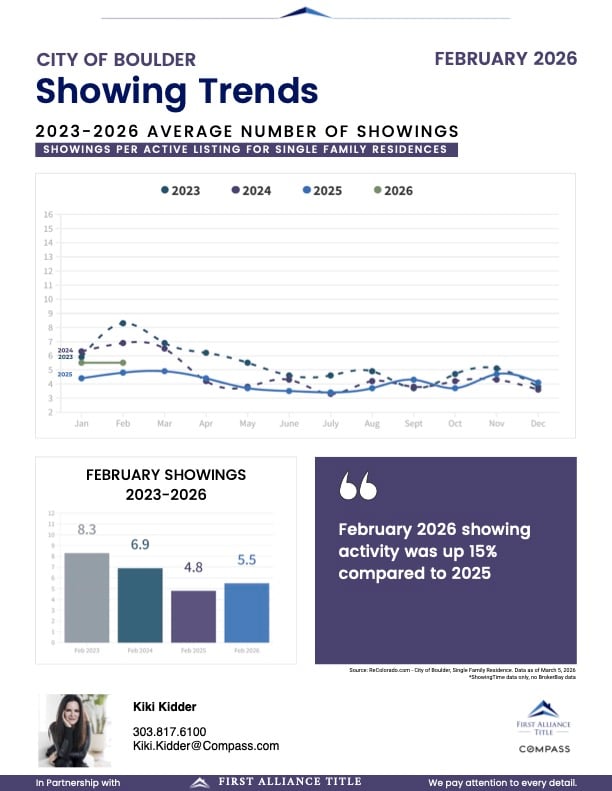
• Showing activity in Boulder increased 15% compared to February 2025.
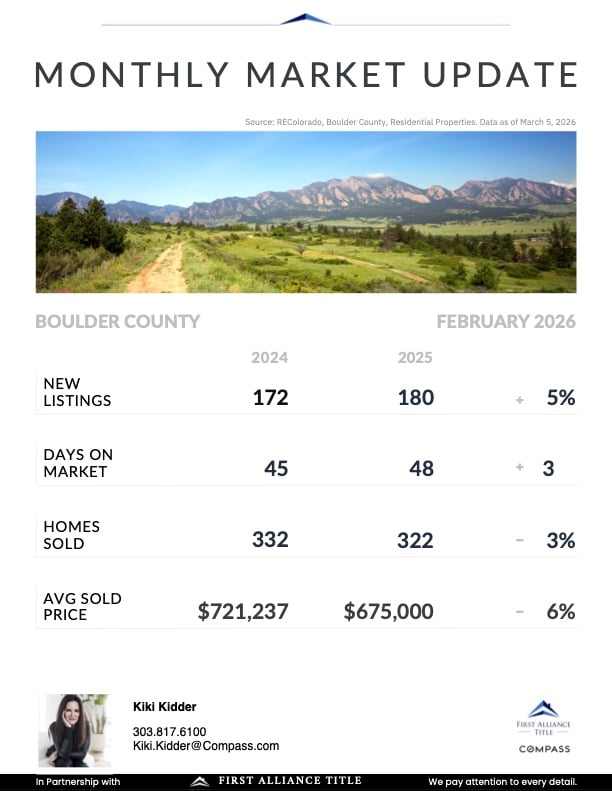
• Across Boulder County, new listings increased 5% while homes sold decreased slightly.
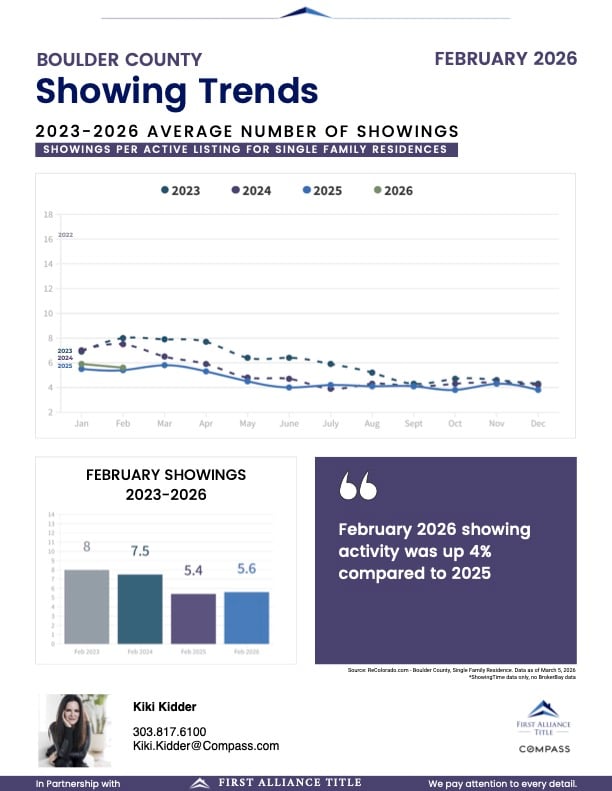
• Showing activity across Boulder County increased 4% year over year.
All statistics referenced are based on data available from REColorado and ShowingTime as of March 5, 2026.
What Is Happening in the Boulder Real Estate Market?
Based on the February data available in early March, housing activity in Boulder and Boulder County showed modest changes compared with the previous year. New listings increased in both markets, while showing activity also rose compared with February 2025. Showing activity reflects how frequently buyers are scheduling property tours and provides one indicator of how actively buyers are viewing available homes.
City of Boulder Market Overview
The February data for the City of Boulder shows modest changes in both listing activity and closed sales.
Highlights from the latest numbers include:
• New listings increased 7%, with 224 homes entering the market compared to 209 the previous year.
• Homes sold increased slightly, rising from 77 sales to 80.
• Days on market remained relatively consistent, moving from 58 days to 59 days.
• The average sold price was $1,260,566, compared with $1,533,471 the prior year.
Average price figures can vary from month to month depending on the types of homes sold during a given period.
Showing Activity in Boulder
Showing activity measures how frequently buyers are scheduling property tours.
According to February data:
• Showing activity increased 15% compared to February 2025.
• The average number of showings per listing was approximately 5.5.
Showing data reflects scheduled property tours and provides one indicator of how actively buyers are viewing available homes during a given period.
Boulder County Market Overview
Looking at Boulder County provides a broader perspective because it includes a wider range of communities and housing types.
February data for Boulder County shows:
• New listings increased 5% year over year.
• Days on market rose slightly, from 45 days to 48 days.
• Homes sold decreased slightly, from 332 to 322.
• Average sold price was $675,000, compared with $721,237 the previous year.
Market conditions can vary across different communities within Boulder County depending on factors such as location, property type, and available inventory.
Showing Activity Across Boulder County
Showing trends across Boulder County also changed slightly compared with the previous year.
February data shows:
• Showing activity increased 4% compared to February 2025.
• The average number of showings per listing was approximately 5.6.
Showing data reflects scheduled property tours and represents one indicator of buyer activity.
Market Context
Real estate activity can change throughout the year as inventory levels, buyer demand, and economic conditions evolve. Reviewing monthly data can help provide additional perspective on how the local market is changing over time.
Because Boulder’s housing market includes a wide range of property types—from condominiums to luxury homes—individual property characteristics can also influence how homes perform in the market.
Methodology & Data Sources
The statistics referenced in this report are based on residential property data from REColorado for the City of Boulder and Boulder County. Showing activity data is sourced from ShowingTime, which tracks scheduled property tours for participating listings.
All data reflects information available as of March 5, 2026. Because real estate markets change continuously, statistics may be updated as additional sales close or new information becomes available.
About the Authors
Kiki Kidder is a third-generation Realtor and longtime Boulder resident with more than 27 years of experience in the local real estate market. Brad Thomas brings a background in technology, analytics, and sales.
Together they lead Kiki & Brad, Realtors at Compass, working with buyers and sellers throughout Boulder County and the Front Range.
Market Data Disclaimer
Market statistics referenced in this report are based on information available from REColorado and ShowingTime as of March 5, 2026. Market conditions may change over time.
