The real story of Boulder is told in long-term data. The FHFA House Price Index provides city-specific insight into a remarkable track record of wealth creation.
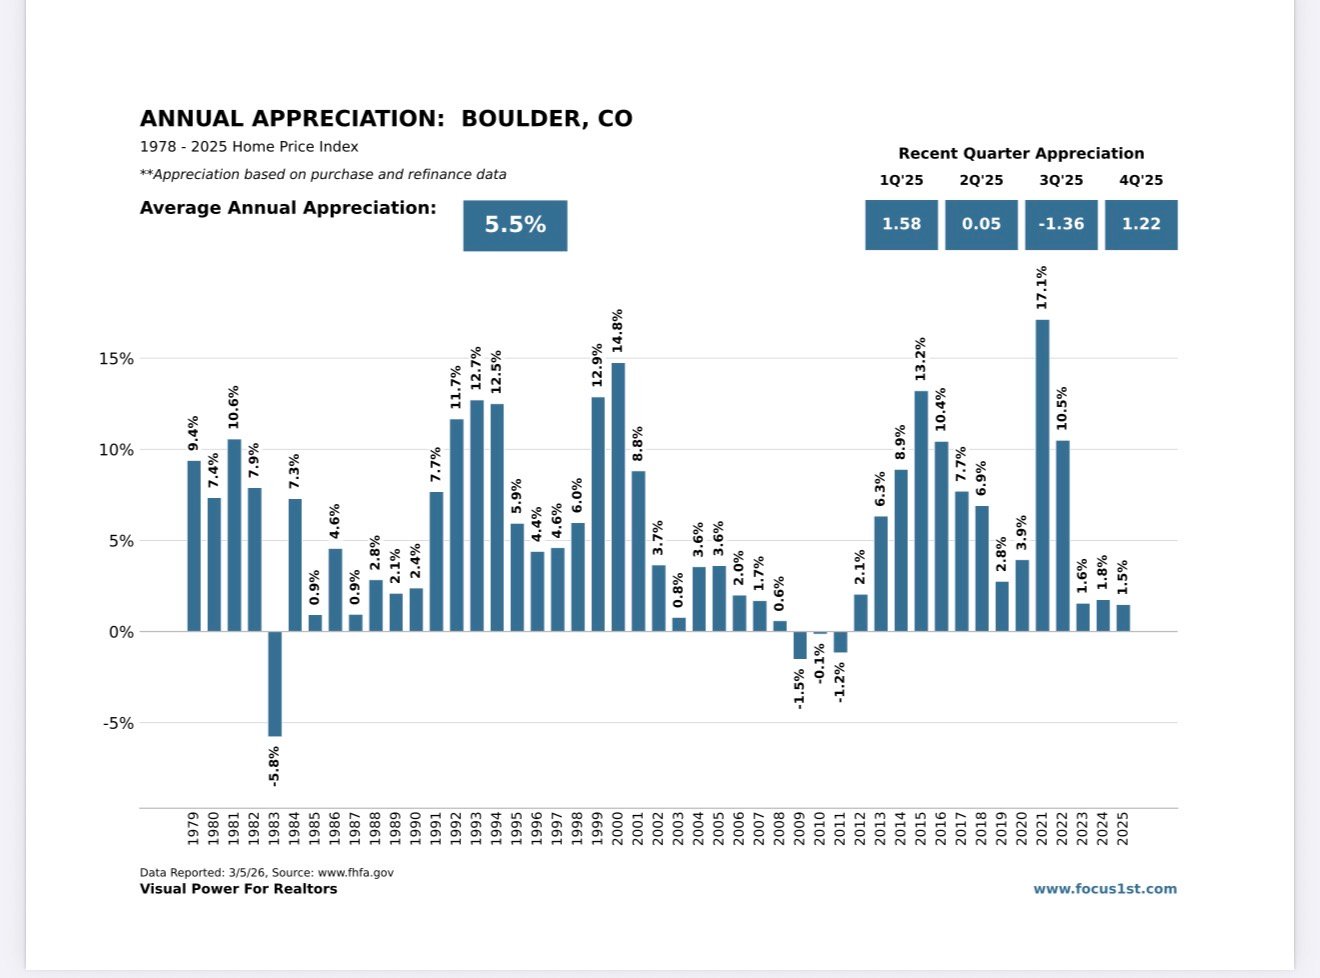
Key FHFA Highlights (1978–2025)
- Average Annual Appreciation: 5.5% over nearly five decades.
- Resilience: Boulder has seen only four "down" years in nearly half a century—1983 , 2009 , 2010 , and 2011.
- 2025: A Year of Normalization:
- 1Q’25: +1.58%
- 2Q’25: +0.05%
- 3Q’25: -1.36%
- 4Q’25: +1.22% (A healthy rebound)
Why This Matters in 2026
In today’s balanced market, this long-term perspective is what separates Boulder from flashier markets. This strength is driven by limited land supply, top-tier schools, and economic anchors that remain steady through market shifts.
The Boulder Constant: 5.5% Average Annual Appreciation since 1978.
Ready to see how this 5.5% track record applies to your home?
Reach out to Kiki Kidder & Brad Thomas | Compass for a Holistic Risk Assessment.
Sources: FHFA House Price Index (City of Boulder), reported 3/5/26; Land Title/Anthony Meisner (March 2026 updates).
Share:
